Business Overview
Well logs present a detailed plot of formation parameters versus depth. From these plots, interpreters can identify lithologies, differentiate between porous and non-porous rock, and quickly recognize pay zones in subsurface formations. The ability to interpret a log lies in recognizing the significance of each measurement. Measurements are uniquely affected by the formation and borehole conditions. The petrophysicist must perform quality control on the data and determine what corrections are required before carrying out a quantitative analysis of the data. The curves are often subject to measurement errors, noise, and other anomalies that can produce outliers. Outliers can distort the overall picture of the subsurface formation and can lead to incorrect interpretations and decisions if not identified and dealt with appropriately. These errors can lead to incorrect decisions and actions, which can result in significant financial losses.
The process of detecting outliers in well log data can vary in time depending on the size of the data set, the complexity of the analysis, and the methods used for outlier detection. For smaller data sets with fewer variables, outlier detection can be relatively quick and straightforward and may only take a few minutes or hours. However, for larger and more complex data sets, detecting outliers can be a time-consuming and iterative process that may take several days or even weeks.
This easy, fast, and reliable outlier detection workflow enhances the overall efficiency and effectiveness of well log data analysis and interpretation, which is critical for making informed decisions about drilling, completion, and production. Instead of spending hours manually inspecting well logs, domain experts can utilize their expertise in interpreting the results and gaining actionable insights.
Highlights
- Build a well log outlier detection model from well log data with ease, taking advantage of Auto ML built-in guardrails.
- Liberate domain experts from repetitive tasks, allowing them to focus on more critical and strategic responsibilities.
- Prevent costly mistakes and errors that can occur due to misinterpretation or improper handling of outlier data.
- Pull data from and to the Techlog wellbore software platform to improve your current workflows.
- Easy to adapt to use with any well log data. Customizable dashboards make visualization easy.
Structured Dataiku flow
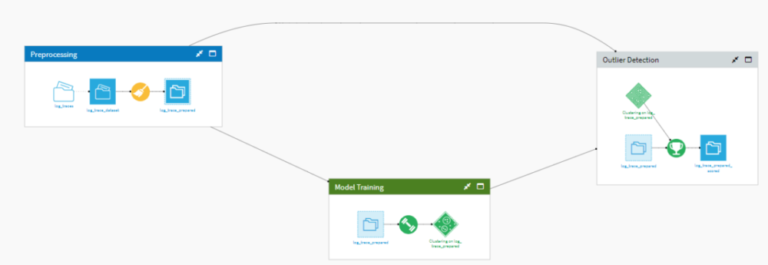
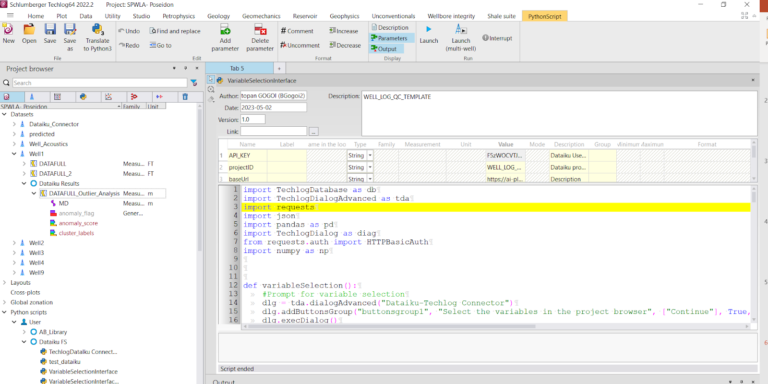
Using the Dataiku-Techlog plugin, you can push well log data to Dataiku, and perform the following steps: data preprocessing, model training, and outlier detection. After the outliers have been identified, the data is pulled back to the Techlog platform using the same plugin.
Data preprocessing
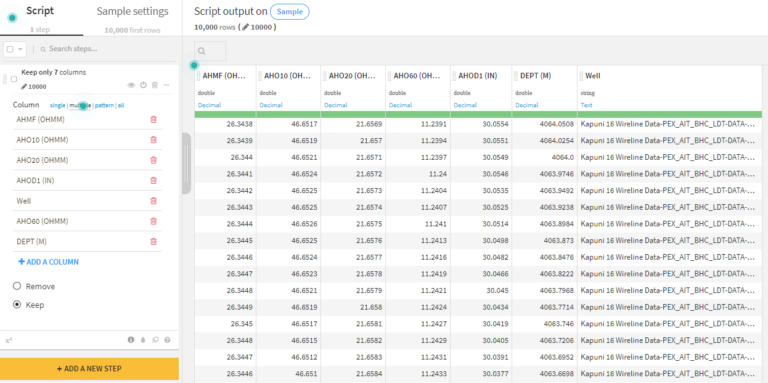
Use Dataiku visual recipes to prepare project data to match the data structure needed. All steps in a data pipeline are automatically documented as part of the visual flow for transparency and ease of reuse.
Model training & Outlier Detection
Using Dataiku Auto-ML guided framework, a machine learning model is trained to detect outliers. The workflow uses an isolation forest algorithm, which is a type of anomaly detection algorithm based on decision trees. After the model is trained and deployed, new data can be scored to detect outliers.
Expected Output
The output contains two extra columns the Cluster labels indicate whether a datapoint is anomalous or regular, and the Anomaly score is the score assigned to each datapoint and can be further used to filter the outliers.
Visualization
The output data generated by the model can be either viewed directly in the flow in raw format or explored through a variety of prebuilt dashboards, which aid rapid visualization. In the dashboard below, two curves were plotted against depth. In each of the curves, anomaly points are color-coded in red.
Export to Techlog
The user pulls back the output data to the Techlog platform.
